
A Summer Markets Deep Dive
Market Commentary || August 15th, 2022
After an impressive summer rally in stocks, it might be helpful to take some data measures and evaluate them to help gain some perspective on the stock market and other assets as we close out the summer season. We will look at:
- Stock market valuations
- Corporate earnings
- Housing valuations
- Interest rates
- Money supply
- Inflation
- Recessionary threats
The point is to take an unbiased view of these things to gain some insight as to what could be in store for Fall/Winter. The stock market rally since the June lows has been impressive. This rally leads many to conclude the threats that had imperiled stocks are now a thing of the past. Rather than engage in a game of semantics, it is very useful to look at data, and see if that data can enlighten us. With no further ado, let’s dig in.
Stock Market Valuations
There are several defensible ways to look at stock market valuations. In this note, we will consider two of them: 1) P/E on trailing earnings, and 2) The much-maligned Shiller-Cape Ration (CAPE = Cyclically Adjusted P/E).
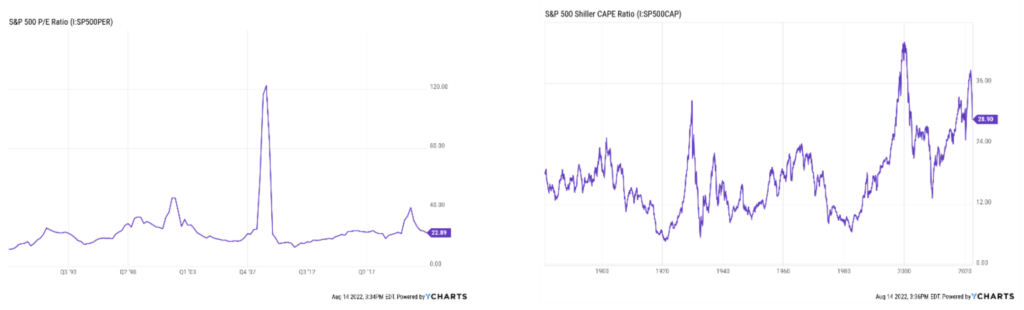
One could make the case that stocks are only slightly over-valued on the first measure. However, stocks are still quite over-valued based on the CAPE. Our conclusion is that the valuation profile of stocks will be a headwind to overcome if stocks are to reach all time highs. Now let’s turn our attention to corporate earnings.
Corporate Earnings
The charts below plot 1) earnings on the S&P 500 Index through first quarter 2022, and 2) the bottom-up forward earnings expectations for the S&P as of June 10. One can see we experienced earnings decline from a prior peak at the end of Q1 2022. Therefore, there has been acute focus on earnings during the recent quarterly releases. Would the downtrend continue, soften, or accelerate? It’s too soon to tell for sure, but the market is telling us earnings are holding up much better than expected. At least so far.
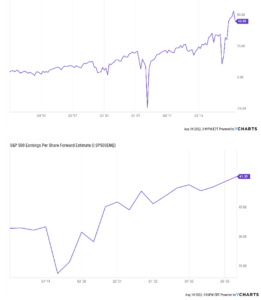
In terms of forward earning expectations, so far, the forward analyst expectations for 2023 are holding their own. This data will be updated in September; but right now, the market is not pricing meaningful downward earnings revisions.
Housing
The above charts depict two elements of the housing market. The first panel shows the Case-Shiller home price index for the US. As can be seen, we are at all time highs on housing values which serves as a strong support for the US economy and economic activity. The second panel shows the NAHB/Wells Fargo Housing Market Index is based on a monthly survey of NAHB members designed to take the pulse of the single-family housing market.
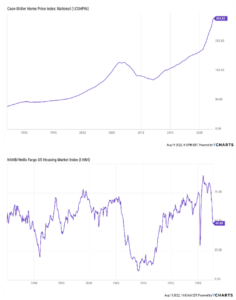
The survey asks respondents to rate market conditions for the sale of new homes at the present time and in the next six months as well as the traffic of prospective buyers of new homes. As can be seen, this measure shows serious weakness in housing. The situation in housing will be a crucible for the economy and is largely dependent on the interest rate environment due to their impact on housing affordability. NAHB/Wells Fargo US Housing Market Index is at a current level of 49.00, down from 55.00 last month and down from 75.00 one year ago. This is a change of -10.91% from last month and -34.67% from one year ago.
Interest Rates
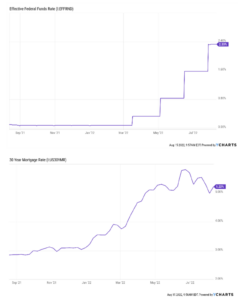
The two panels below depict two important drivers of economic activity. The first is the Fed Funds rate which affects the cost of money as it circulates through the economy. Higher cost of money equates to slowing economic activity. An important area this affects is depicted in the second panel: the interest rate on the average 30-year mortgage in the US. This rate is what is having the material negative impact on the housing market activity depicted above.
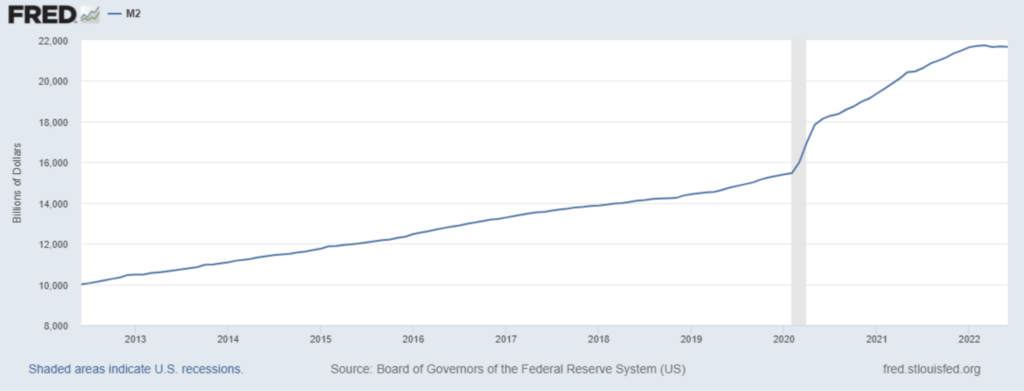
Money Supply
The good news is that money supply has stopped growing. For those who believe that inflation is a monetary phenomenon, then this is good news. The only question is how long it takes for the lack of money growth to circulate through the economy and bring consumer prices down.
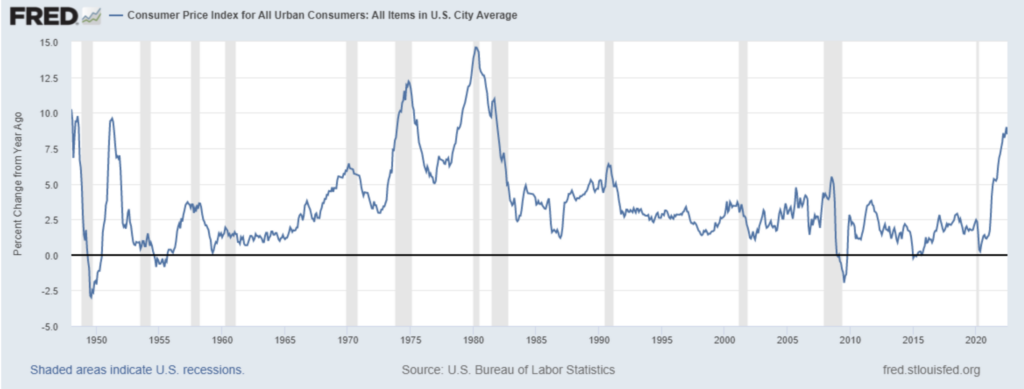
Inflation
The panel below shows consumer prices as measured by the CPI on a one-year basis. Despite the rhetoric, the only thing we are seeing in the inflation data that is constructive is that it is no longer accelerating. Is it decelerating yet (the so-called disinflation)? Maybe. But remember, inflation above 4% is a meaningful drag on the value of money. This means consumer well-being is threatened as inflation persists. Inflation levels above 8% is a massive threat. The Fed must get the rate of inflation below 4%. The only way to do this is to raise rates and/or to experience deteriorating economic activity. Full stop.
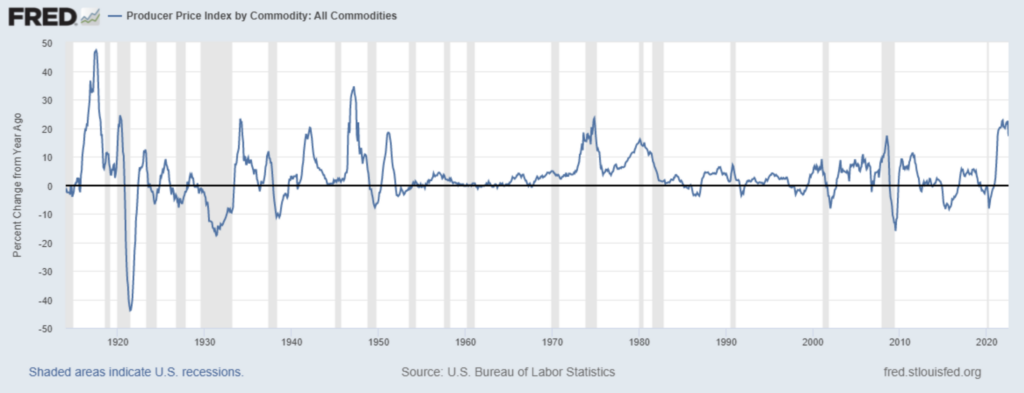
The silver lining on inflationary pressures is that inflation in commodities (the so-called producer-prices) is abating somewhat. Eventually these prices will filter through to consumer prices.
Recessionary Threat
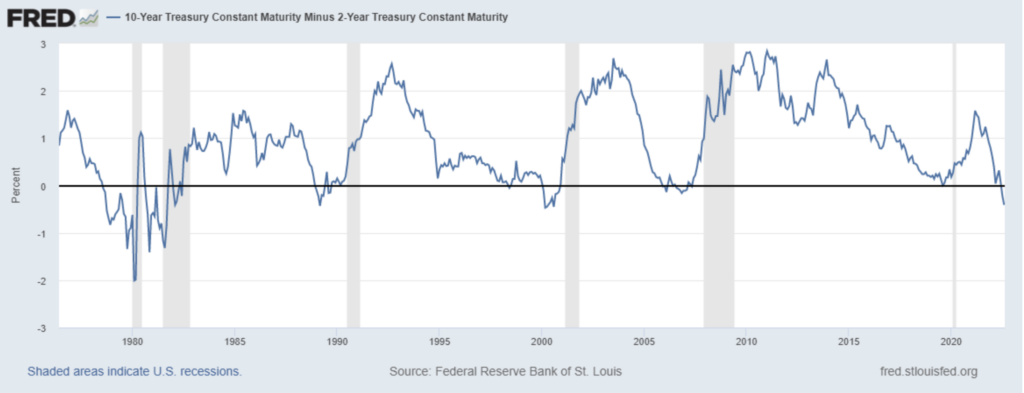
The Biden administration is going out of its way with rhetorical gyration to dismiss the recent declines in GDP as not necessarily recessionary. Whether or not we are currently in recession, or the economy is merely slowing will be resolved in the coming months. For now, a look at the yield curve should suffice. This signal has a perfect record indicating when the economy is in recession (when it dips below zero). The yield curve is giving the clear signal that we are either in, or will soon be in, a recession.
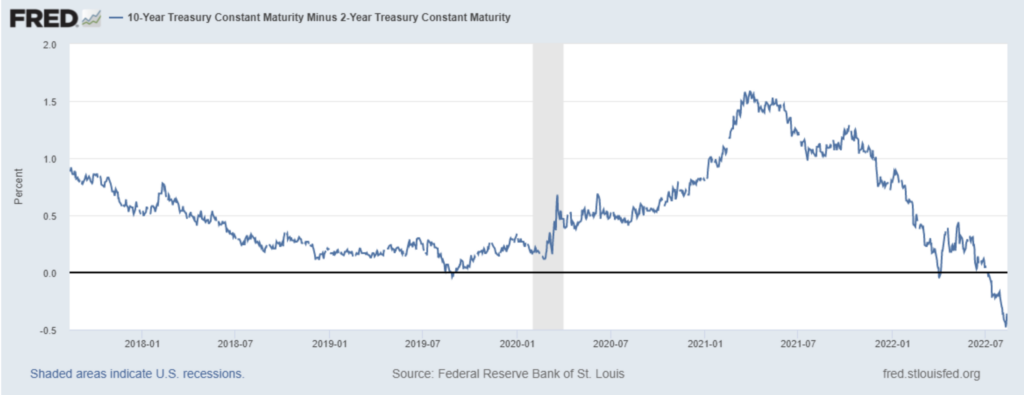
Here is a long-term view of the same chart. In this view, it can be seen an inversion usually precedes recession by a couple of quarters.
Concluding Remarks
The summer rally has brought a refreshing period of ease to investors who had experienced steep losses. Now, folks are feeling pretty good again. That’s the good news. Whether or not the stock market bottom is in, and the worst is over is an open question. Stock valuations are now somewhat stretched, but so far corporate earnings are holding up. Rising interest rates to combat inflation continue to be the focal point. This has been the primary cause of housing activity weakness this year. Whether those rising rates will usher in broader economic weakness and a recession is uncertain; but the yield curve is flashing a warning sign.
It is against this backdrop that we conclude summer and usher in fall. It is important to remember in times like these that are punctuated by heightened uncertainty that, in the long run, markets tend to go up and periods like this fade into the distance. We continue to manage client portfolios against this longer-term view. Please enjoy the remainder of your summer and trust we continue to be laser focused on your portfolios and their long-term health.
The opinions voiced in this material are for general information only and are not intended to provide specific advice or recommendations for any individual. To determine which Investment(s) may be appropriate for you, consult your financial advisor prior to investing. Information is based on sources believed to be reliable, however, their accuracy or completeness cannot be guaranteed. No investment strategy can assure success or completely protect against loss, given the volatility of all securities markets. Statements of forecast and trends are for informational purposes and are not guaranteed to occur in the future. All performance referenced is historical and is no guarantee of future results. Securities investing involves risk, including loss of principal. An investor cannot invest directly in an index.
Advisory services offered through WealthPlan Investment Management, a subsidiary Registered Investment Advisor of WealthPlan Group, LLC.