
What happened in the week just past?
As we said in our note a week ago, the CPI report would be a meaningful data point for the markets. Unfortunately, the print for inflation was higher than the 7.2% expected annual rate. Inflation came in at 7.5%, spooking markets and truncating what appeared to be an attempt by equity markets to rally to highs. As this happened, interest rates spiked in anticipation of more aggressive Fed policy in the form of a potential 50-basis point rate hike in the next three months. This is by no means a foregone conclusion. The Fed is like a waiter carrying a glass of water filled to the brim—it wants to minimize the bumps and gyrations while carrying it to its destination which in this convoluted metaphor is a healthy economy with modest inflation at our around 2%. The Fed has seen what if they were to implement very abrupt and violent moves it can have a destabilizing effect on the market—think Taper Tantrum and 2018. The last thing the Fed wants to do is spill a bunch of that proverbial water on themselves or even worse, on the customer (us). As such while there is the possibility of multiple rate hikes in March, we would expect the Fed to signal well beforehand what they plan on doing to keep us all from overreacting and causing more harm than good.
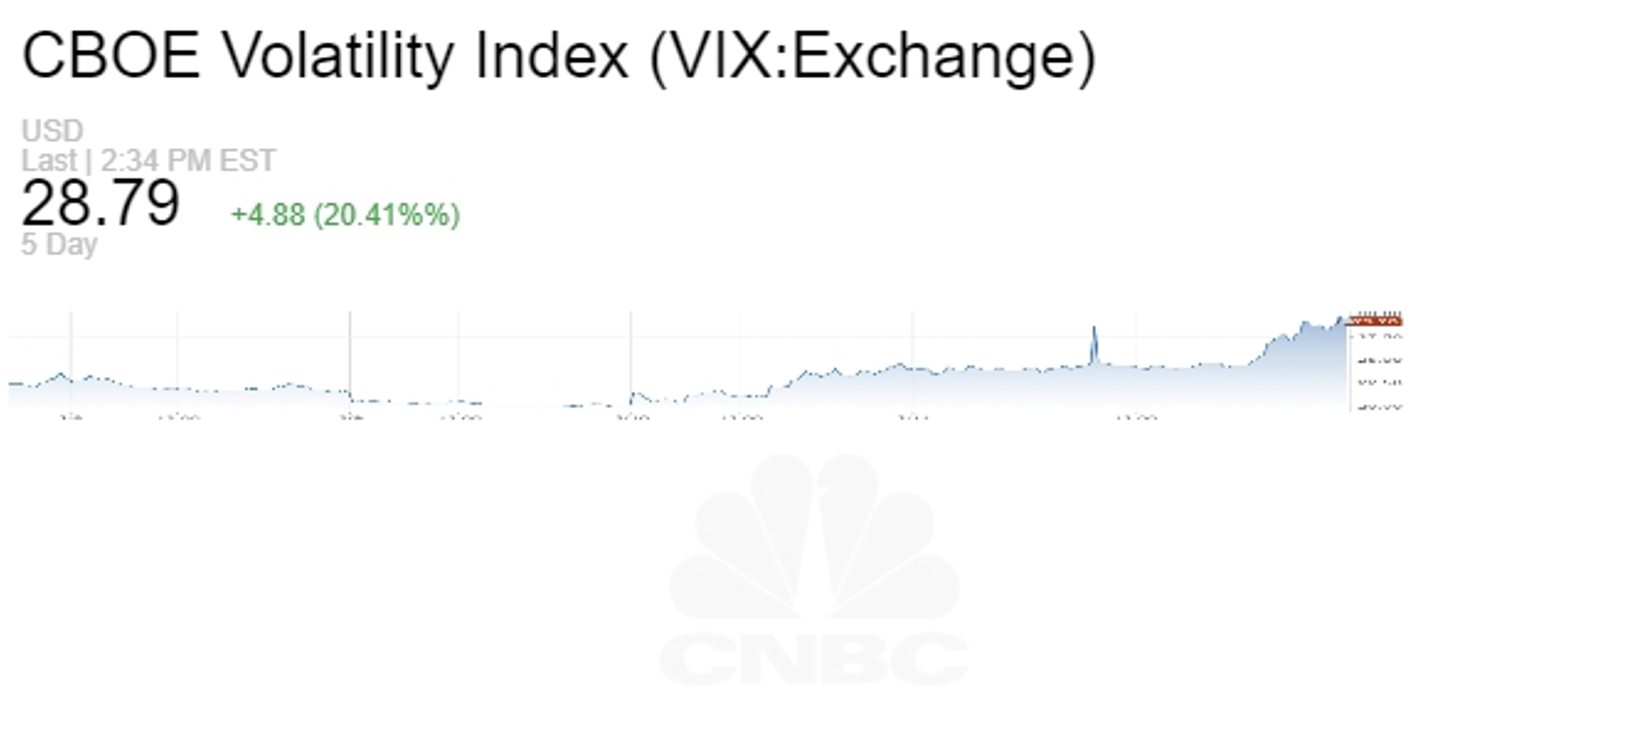
The rise in rates, mostly localized on the shorter end of the yield curve has continued to cause the overall Treasury yield curve to flatten as bond markets began pricing the impact of rate tightening on economic activity. Right now, uncertainty prevails. Consequently, we expect continuing volatility as markets come to grips with what is looking more and more like a looming economic contraction. VIX (a measure of volatility) is sitting at 30 on Friday afternoon after beginning the day at 20.
On top of all this, Russia is looking more like it will invade Ukraine, which creates additional uncertainty. Many nations, including the US and UK, have told citizens in Kyiv to evacuate. Given all of this, we expect more uncertainty, more volatility, and more intraday reversals.
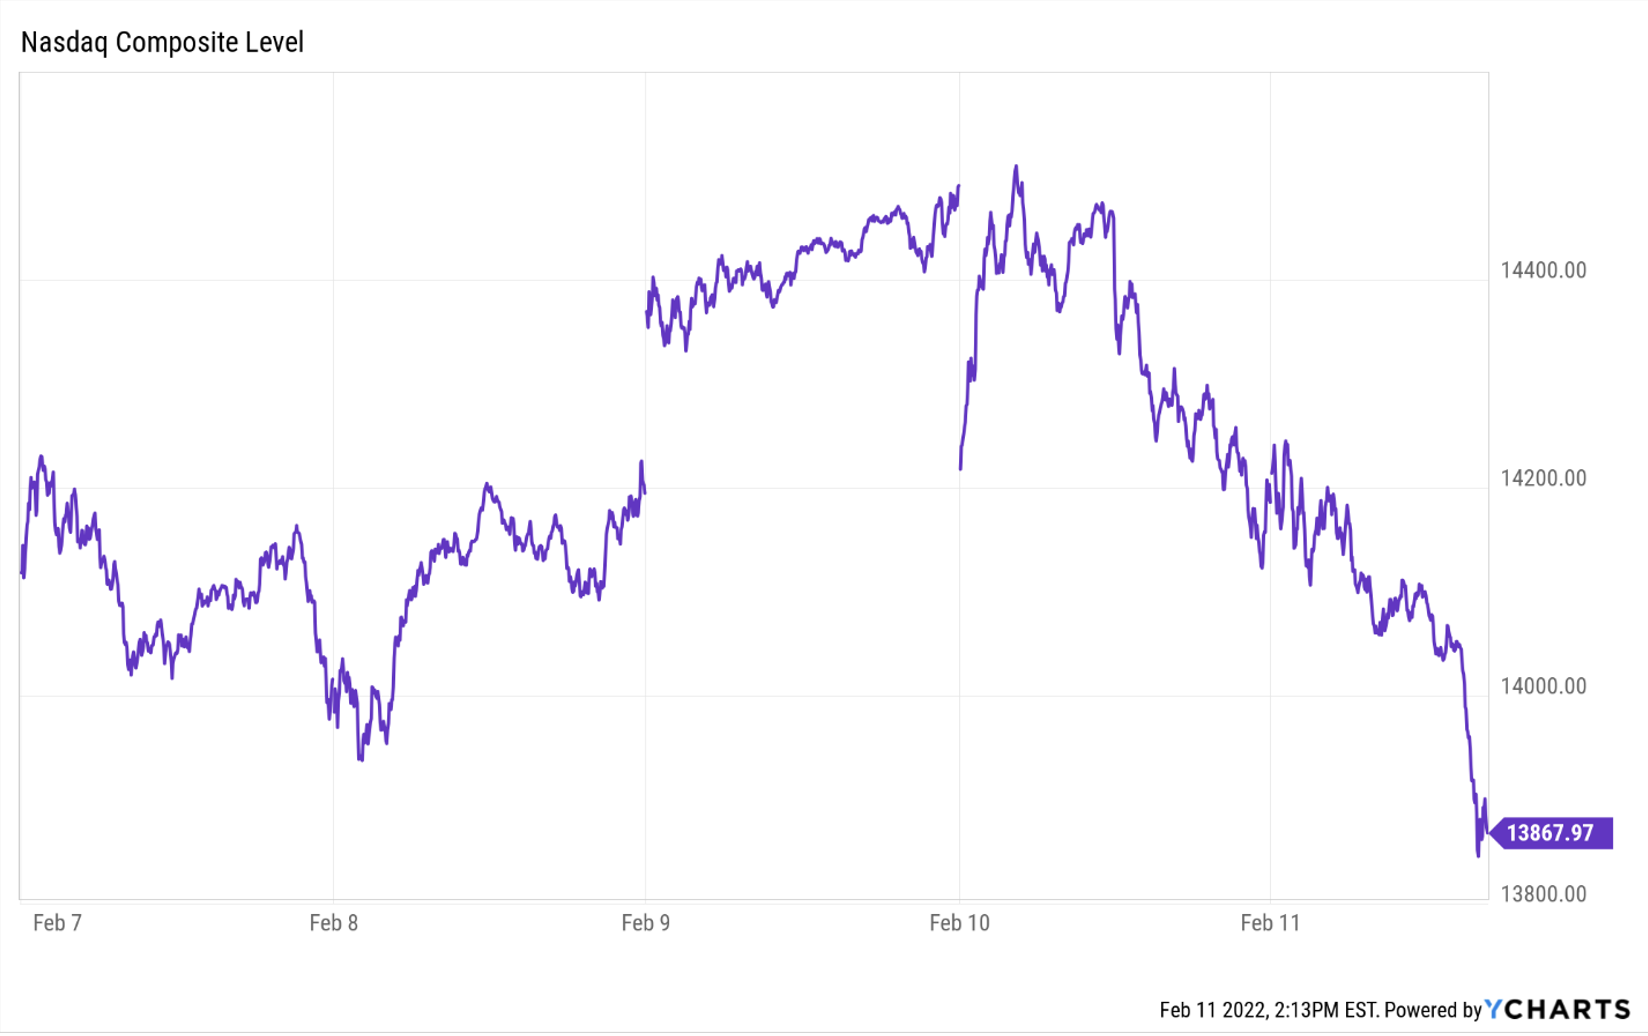
Here is a look at last week in Five charts:
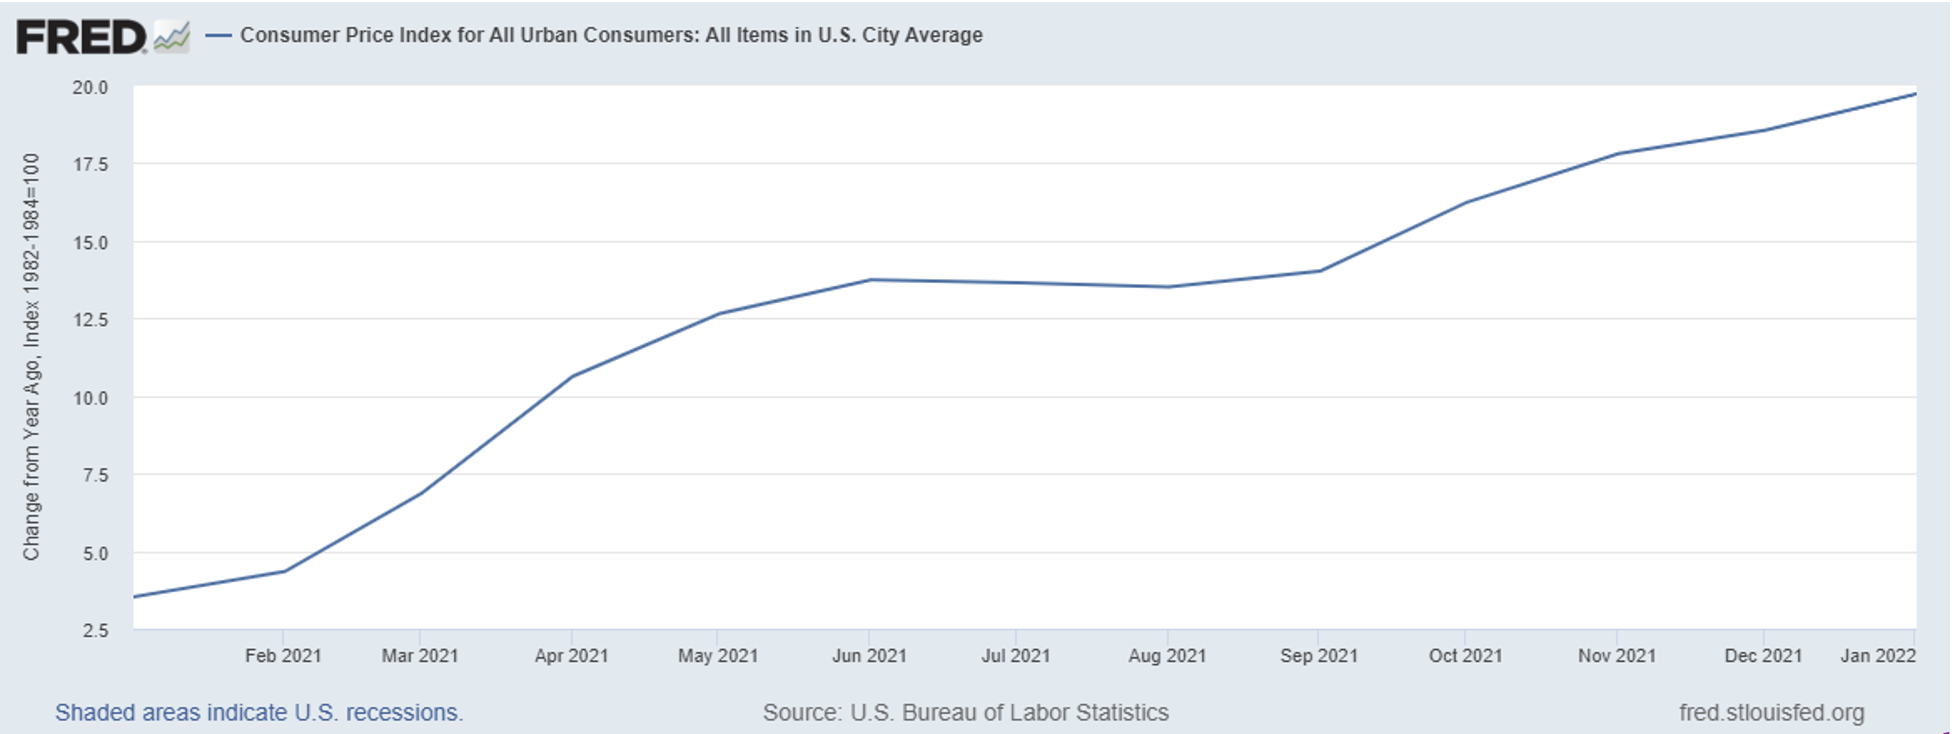
- Here is the one-year % change CPI over the past year–we are inflating! How this YoY comparison will look in the next few months–think April or May—will be important. At that stage we would be comparing current numbers to a time in 2021 that has entered a reinflation environment, and rolling off some numbers from when oil went negative:
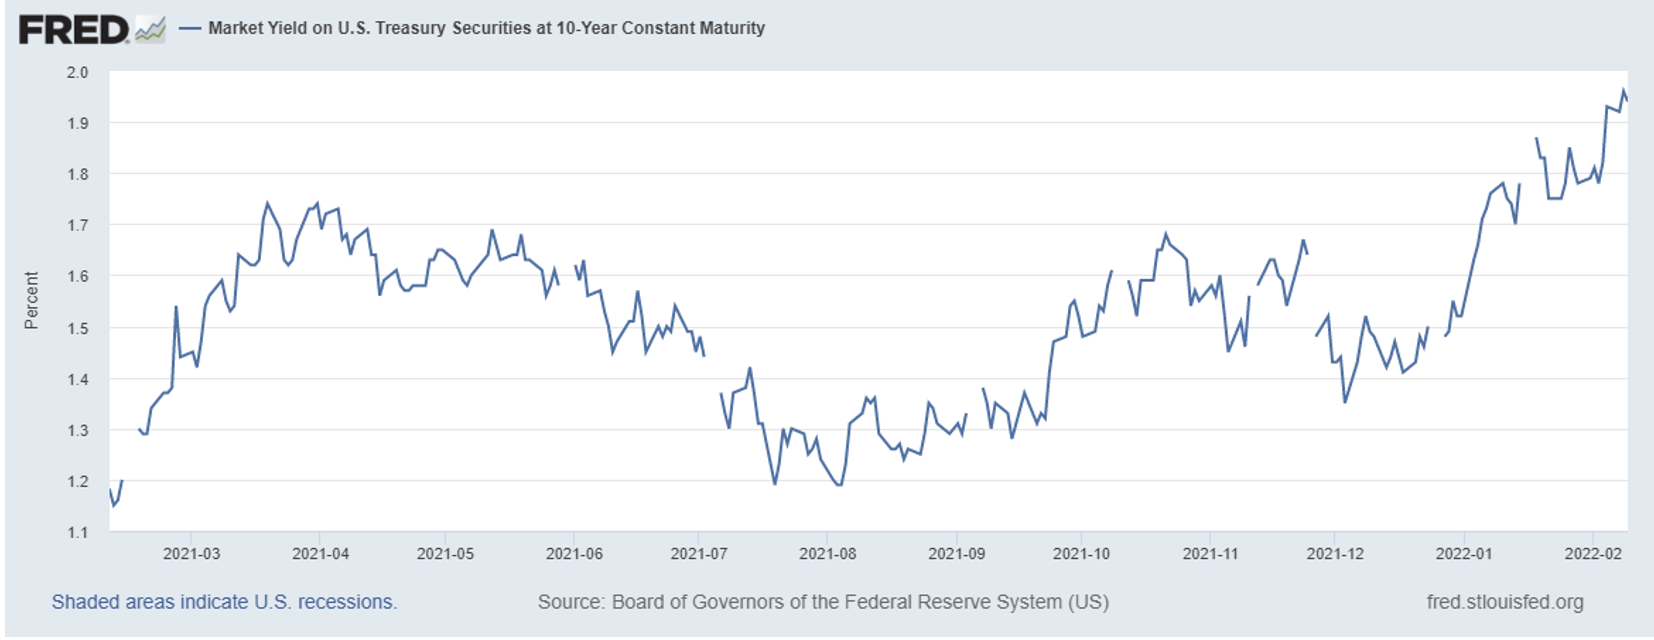
- Here is the 10-year yield over the past year–bond markets are not only pricing in higher rates but also anticipating a fight:
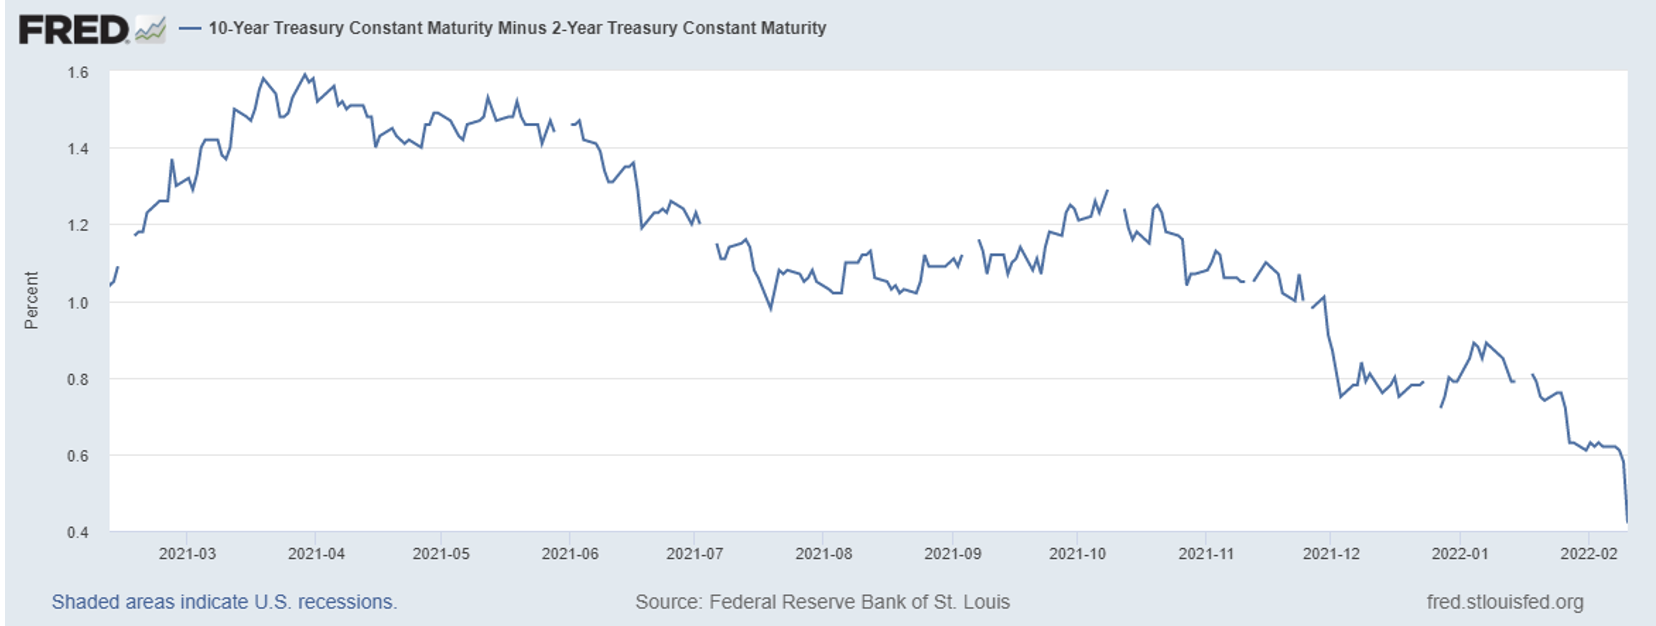
- Here is the 2Y10Y yield curve spread for the past year, when this goes negative it often heralds a recession–bond markets are getting more nervous. To be sure, it isn’t fool-proof, it has technically predicted 10 of the last 6 recessions meaning it has a fair amount of false positives.
- Here is VIX, an index that provides an expectation of 30-day volatility.Markets are getting nervous. On the bright side, the 30 mark tends to be a barrier for the VIX. Often times, when it hits 30 it reverts back below. We will be monitoring in case it meaningfully breaks above 30 and closes above 30.
- The NASDAQ has performed the worst of the US indexes as investors start to price in rate hikes and the rotation from growth into value continues.
The market is telling us things are changing. We are still in a period where liquidity is plentiful and fed policy is accommodative. So this still provides market support. BUT, the market knows this support is going away and is anticipating a reversal of policy.
The week ahead
We will see data on retail gas prices, producer prices, building permits, and housing starts. On top of this we will see more earnings announcements. It is quite possible we are in a period where earnings growth is still coming in strong while markets retreat on valuation concerns and forward earnings guidance.