
Financial Fitness Part II

Last week we wrote about financial fitness, drawing parallels between physical fitness and financial fitness. With physical health, achieving fitness comes from a combination of discipline in both diet and exercise. Even if one is diligent with physical fitness, all that hard work can be undone with poor eating habits. With financial health, achieving fitness comes from a combination of discipline in spending/saving and investing. We discussed that even the best constructed investment portfolio cannot compensate for undisciplined spending habits. Poor spending habits can undo a well-designed investment portfolio. Given this, we think it is important to show the reader the data to support the points about spending discipline that we are making.
To illustrate these principles, we will construct a simple portfolio consisting of 60% allocated to the S&P 500 Index, and 40% allocated to the Bloomberg Aggregate Bond Index. For the purpose of this example, we used a simple rule to rebalance to our target weights every quarter and subtracted a 1% annual management fee from the portfolio. Our start date was January 2, 1990, and our ending date was December 8, 2023 (just this past Friday.) This is what that portfolio return looks like:
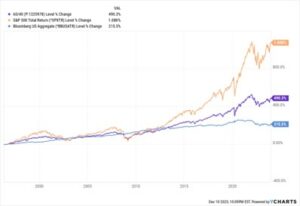
One can see that the S&P 500 Index (orange line) outperformed the bond index (light blue line) over the past 34 years but did so with a lot more price volatility. However, as we’ve said, how the portfolio performs is just half the equation. How much a person spends in relation to that portfolio is also critically important.
To illustrate the importance of how much you spend relative to how your portfolio performs, we are examining two spending scenarios: 1) You withdraw 4% of your portfolio value per year, and 2) You withdraw 10% of your portfolio value per year. For this example, we are assuming you invest $1,000,000 at the beginning of 1990 and ignoring taxes, which in real life will reduce the amount you have available to spend after you withdraw your funds. We also assume there are zero contributions to the portfolio after the initial $1,000,000 investment. We think these illustrations will be illuminating.
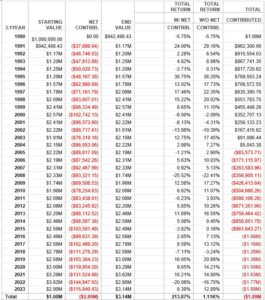
In the 4% annual withdrawal table below, some important things stand out. 1) As the portfolio declines in value, the amount of dollars you withdraw each year declines. 2) As the portfolio grows in value, the amount of dollars you withdraw grows. 3) At the very bottom of the table you can see the totals which are very instructive:
- With this spending rule, you will have withdrawn a total of $2.89 million over thirty-four years.
- Even with these withdrawals, your ending portfolio would have been 3.14 million.
- Importantly your last 4% withdrawal in dollar terms would have been $115,000, which is three times larger than your first-year withdrawal of 38,000.
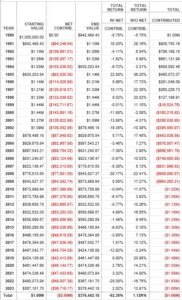
In the 10% annual withdrawal table below, some important things stand out. 1) As before as the portfolio declines in value, the amount of dollars you withdraw each year declines. 2) Also as before, as the portfolio grows in value, the amount of dollars you withdraw grows. 3) At the very bottom of the table you can see the totals which are very instructive:
- With this spending rule, you will have withdrawn a total of $2.66 million over thirty-four years. This is about $220,000 less (counterintuitively) than you would have withdrawn with the 4% spending rule.
- With these more aggressive withdrawals, your ending portfolio would have been only $376,000, substantially less than the 3.14 million you still had with the 4% spending rule.
- Importantly your last 10% withdrawal in dollar terms would have been only $37,000, which is almost 1/3 of the size of the withdrawal you would have made with the 4% spending rule.
When one evaluates and compares the differences in the total portfolio values over time between these two spending rules, you can see how important it is to thoughtfully plan both your investment portfolio structures and your spending rules. The most important idea is that you don’t want to outlive your money in retirement, and you want to have a withdrawal policy that provides satisfactory annual income in retirement.
We encourage you to speak with one of our advisors to develop a plan that helps you set the policies that will help you achieve your retirement income goals while preserving your capital at a level that makes you comfortable. And it always bears repeating, past results are no guarantee of future results. Financial markets may not produce the same level of return in the next 34 years as they did in the past 34 years! We are here to help you plan for all these uncertainties and still have a comfortable retirement. Please let us know if we can help.
=====================================================================================================
Advisory services offered through WealthPlan Group, a DBA name for WealthPlan Investment Management, a registered investment adviser. WealthPlan Group, LLC is the holding company for WealthPlan Partners LLC and WealthPlan Investment Management LLC. WealthPlan Group, LLC is not a registered investment adviser.
The performance presentation is for illustrative purposes only and does not represent an actual client’s portfolio or firm strategy. No investment strategy can assure success or completely protect against loss, given the volatility of all securities markets. Statements of forecast and trends are for informational purposes and are not guaranteed to occur in the future. All performance referenced is historical and is no guarantee of future results. Securities investing involves risk, including loss of principal. An investor cannot invest directly in an index.
The S&P 500 Index, or Standard & Poor’s 500 Index, is a market-capitalization-weighted index of 500 leading publicly traded companies in the U.S. The S&P 500 index is regarded as one of the best gauges of prominent American equities’ performance, and by extension, that of the stock market overall.
The Bloomberg US Aggregate Bond Index (^BBUSATR) is used as a benchmark for investment grade bonds within the United States. This index is important as a benchmark for someone wanting to track their fixed income asset allocation.
Indices are unmanaged. An investor cannot invest directly in an index. They are shown for illustrative purposes only and do not represent the performance of any specific investment.
The opinions voiced in this material are for information purposes only and are not intended to provide specific advice or recommendations to any individual. Please consult with your financial professional about your specific situation. Information is based on sources believed to be reliable, however, their accuracy or completeness cannot be guaranteed.