
Market Valuations and Big Cap Tech

At the midway point of this current earnings season, FactSet has reported that both earnings and revenue are up over 2% from a year ago. This resumed growth lends credence to arguments that—after a shallow earnings recession—corporate earnings growth has resumed. We will be monitoring earnings as they come in over the next couple of weeks but are encouraged by this return to growth so far.
Despite the nascent return to growth, stocks have remained in their funk that began in the third quarter. October witnessed additional erosion of stock returns. Here’s what market returns look like since the first of August:
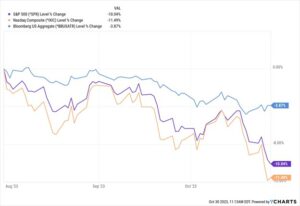
Stocks and bonds are both down, with the tech-heavy NASDAQ stock index leading the way. From our perspective, this is welcome news as we think stocks were a bit expensive after the rally this year. Going forward, we feel more encouraged that stock valuations are a bit more reasonable even as earnings growth resumes.
While stocks are somewhat expensive, we see higher valuation levels in the biggest cap stocks. To wit, here are the top ten capitalization stocks in the S&P 500 Index and their P/E ratios:
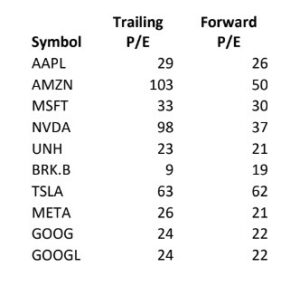
These ten stocks account for approximately 30% of the total capitalization of the S&P 500 Index. As such, their higher P/E’s distort the index P/E. If one were to strip these stocks out, the overall P/E of the market is much more reasonable. Our view is that the market likes these big cap tech names a lot right now (NVDA, AMZN, and TSLA). The market expectations for their prospective growth are through the roof. These companies will need to deliver to grow into their valuations, but we might find the valuations prove to be somewhat of a head wind as they produce earnings results in the coming quarter. Also, any fundamental misstep and their shares will likely be harshly treated.
Overall, we are cautiously optimistic that the market will not be substantially lower into the close of the year and remain open to the possibility a Santa Claus rally may once again occur come December.
============================================================================================
The S&P 500 Index, or Standard & Poor’s 500 Index, is a market-capitalization-weighted index of 500 leading publicly traded companies in the U.S. The S&P 500 index is regarded as one of the best gauges of prominent American equities’ performance, and by extension, that of the stock market overall.
The NASDAQ Composite is a stock market index of the common stocks and similar securities listed on the NASDAQ stock market. The composition of the NASDAQ Composite is heavily weighted towards information technology companies.
The NASDAQ-100, whose components are a subset of the NASDAQ Composite’s, accounts for over 90% of the NASDAQ Composite’s movement, and there are many ETFs tracking its performance.
The Bloomberg US Aggregate Bond Index (^BBUSATR) is used as a benchmark for investment grade bonds within the United States. This index is important as a benchmark for someone wanting to track their fixed income asset allocation.
Indices are unmanaged. An investor cannot invest directly in an index. They are shown for illustrative purposes only and do not represent the performance of any specific investment.
Advisory services offered through WealthPlan Group, a DBA for WealthPlan Investment Management, a subsidiary Registered Investment Advisor of WealthPlan Group, LLC. WealthPlan Group, LLC is not a registered investment advisor, but is the holding company for WealthPlan Partners LLC and WealthPlan Investment Management, LLC.
The opinions voiced in this material are for general information only and are not intended to provide specific advice or recommendations for any individual. To determine which Investment(s) may be appropriate for you, consult your financial advisor prior to investing. Information is based on sources believed to be reliable, however, their accuracy or completeness cannot be guaranteed.
No investment strategy can assure success or completely protect against loss, given the volatility of all securities markets. Statements of forecast and trends are for informational purposes and are not guaranteed to occur in the future. All performance referenced is historical and is no guarantee of future results. Securities investing involves risk, including loss of principal. An investor cannot invest directly in an index.
The information in this communication applies solely to the intended audience and in no way amends, revokes, or otherwise alters the existing agreements and relationships between WPIM and its clients. This communication is not a binding offer, expressed or implied. WPIM undertakes no obligation to update or revise the information herein or in any referenced third-party resource due to new information, future events or circumstances, or otherwise.
WealthPlan Investment Management (“WPIM”) uses data compiled and/or prepared by third parties (“Third Party Data”) in the delivery of Licensed Research and Data. Third Party Data is not owned by WPIM, and user may be required to obtain permission directly from third parties for further use of Third-Party Data and may be required to pay a fee depending on the use contemplated by the user.