
More Confounding Mixed Signals
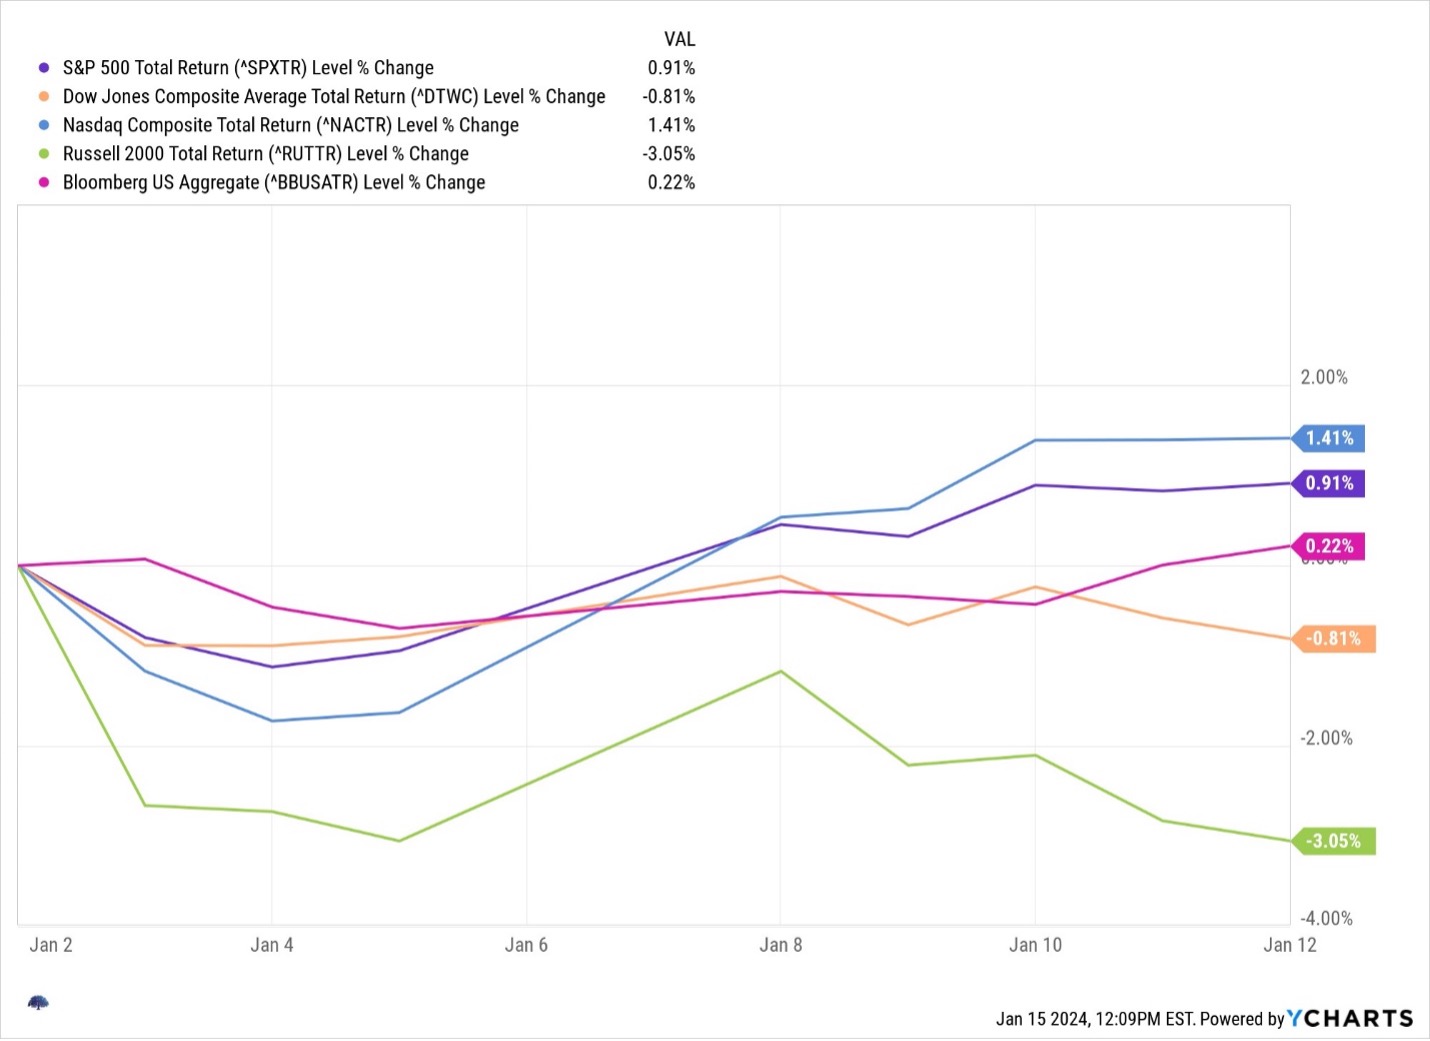
We concluded 2023 on a hopeful note, seeing a fourth quarter broadening of equity market participation with solid returns to former laggards: Namely, small/mid cap stocks and dividend growers broadly participated in the fourth quarter market rally. The markets were trading on the view that inflation was conquered, the soft landing was a done deal, and interest rates would be coming down. But, for the first two trading weeks of 2024, the markets more resembled the first three quarters of 2023, with the NASDAQ leading the way, industrials lagging a bit, and small caps lagging materially. Bonds are chugging along producing returns so far consistent with a mid-5% return for the year IF things continue along the same lines for the rest of the year. But that is a BIG if!
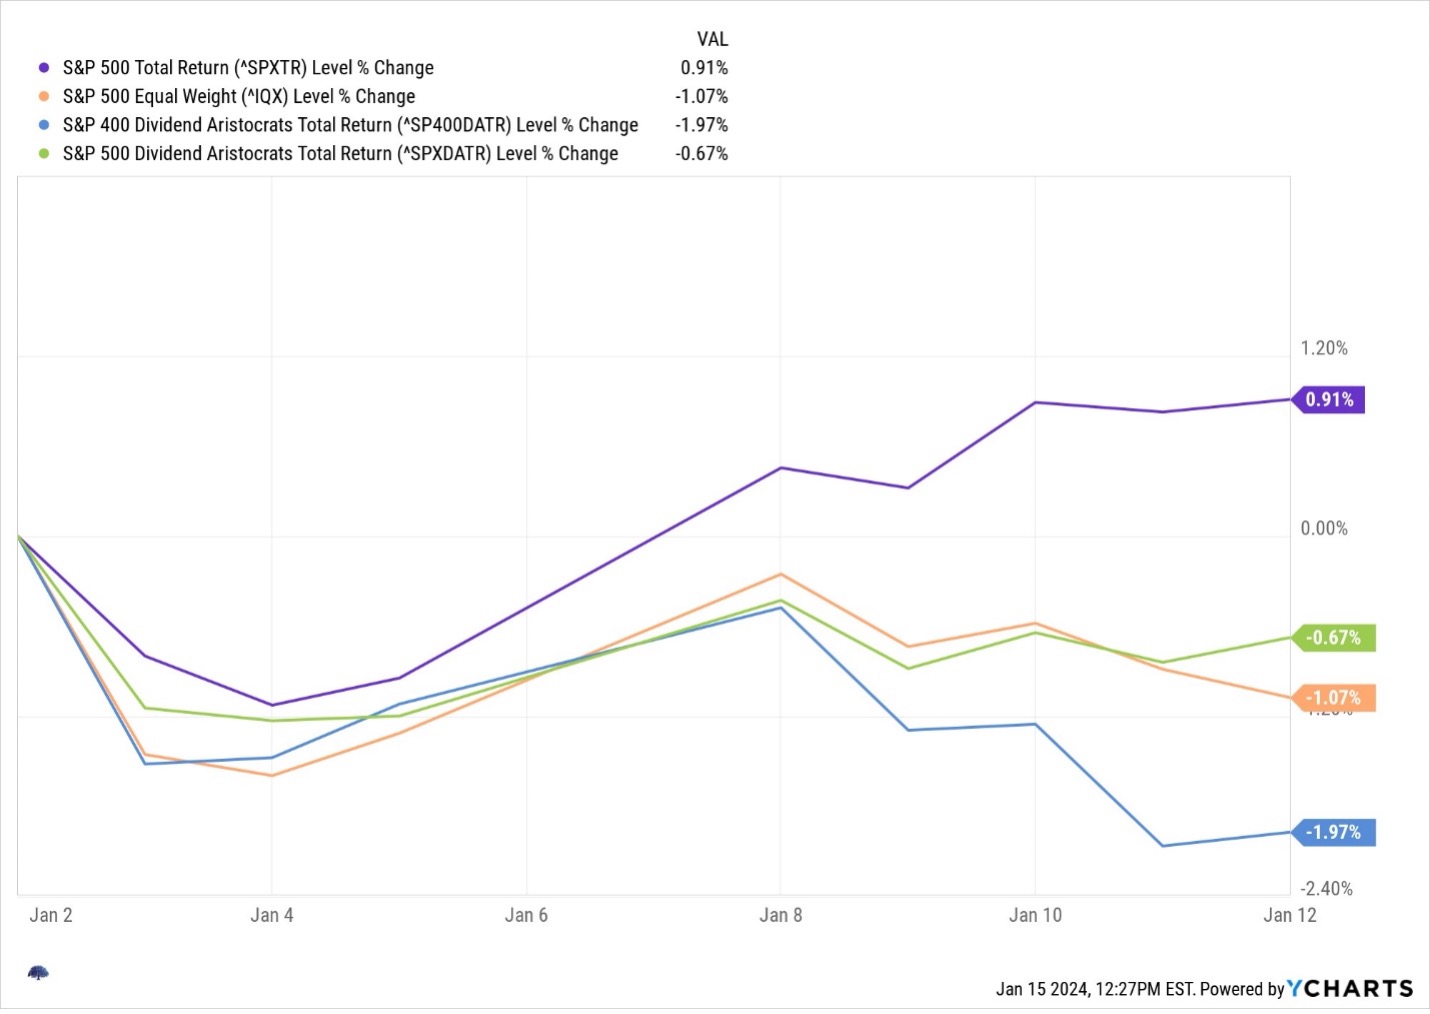
Beneath the surface of broad equity market returns are some interesting subtexts: namely, we are back to narrow markets. The chart below depicts some of these subcurrents. The S&P equal weighted index is negative and far behind the cap weighted version of the index; meaning the mega cap stocks again are dominating index returns. Moreover, the dividend growers are lagging, and it is even more challenging for the small and mid-cap dividend growers.
What are we to make of the markets so far this year? For one, there doesn’t seem to be any clear consensus on the health of the economy. Still in play are the ideas that: 1. Recession is still a possibility, 2. Inflation may prove to be more difficult to tame, and 3. Interest rates may not come down as soon or with a magnitude expected just a few weeks ago. Because of these uncertainties, we are back to the capital market patterns that dominated the first 10 months of the year. Until these issues resolve and manifest in concrete data, we will likely vacillate in 2024 between these two market scenarios: Narrow vs. broad and rotating back and forth as the market ingests new information.
It is against this backdrop of heightened uncertainty that WealthPlan group’s Smarter Portfolio strategies shine. We have enough exposure to the things that work in either scenario so we always have some positive gains in portfolios should either scenario dominate. Of note, we will benefit and participate more fully in an environment that includes dividend growers and small/mid cap stocks, so we are routing for a broader market. But we can produce positive returns in either scenario. Moreover, if things get ugly and recession manifests, we have enough “defensively oriented” exposure to hold up relatively well. We look forward to learning how things will develop over the coming months. Thanks for the trust you place in us.
The S&P 500 Index, or Standard & Poor’s 500 Index, is a market-capitalization-weighted index of 500 leading publicly traded companies in the U.S. The S&P 500 index is regarded as one of the best gauges of prominent American equities’ performance, and by extension, that of the stock market overall.
Equal-weight indices include the same constituents as their respective market-cap-weighted indices, but each company is allocated a fixed equal weight in the index at each quarterly rebalance.
The Russell 2000 tracks the roughly 2000 securities that are considered to be US small cap companies. The Russell 2000 serves as an important benchmark when investors want to track their small cap performances versus other sized companies. The Russell 2000 tends to have a larger standard deviation in comparison to the S&P 500.
The Bloomberg US Aggregate Bond Index (^BBUSATR) is used as a benchmark for investment grade bonds within the United States. This index is important as a benchmark for someone wanting to track their fixed income asset allocation.
The S&P MidCap 400® Dividend Aristocrats is designed to measure the performance of mid-sized companies within the S&P MidCap 400 that have consistently increasing dividends every year for at least 15 years.
S&P 500® Dividend Aristocrats® measure the performance of S&P 500 companies that have increased dividends every year for the last 25 consecutive years. The Index treats each constituent as a distinct investment opportunity without regard to its size by equally weighting each company.
Indices are unmanaged. An investor cannot invest directly in an index. They are shown for illustrative purposes only and do not represent the performance of any specific investment.