
The Earnings Crucible
After sharp equity market declines this year, many market observers are of the belief that the stock market is now “fairly valued.” We hear it all the time. Some people even say that the market is cheap. Usually, people who espouse this view are referencing the price today compared to the forecasted earnings in twelve months. One thing is certainly true, with the S&P down 23% since the beginning of the year and the NASDAQ down 29%, stocks are much less expensive today compared to the start of the year. But to get a sense for exactly how cheap stocks are compared to their earnings power, more nuanced analysis beyond price-to-forward-one-year earnings is needed. First, let’s set the table.
What’s in a P/E ratio?
The P/E ratio is composed of Price (P) divided by Earnings (E). Every publicly traded stock of a company that has earnings then, by definition, has a P/E ratio. And given this, any stock index has an aggregate level of earnings for all the stocks included in the index and an aggregate price level of all the stocks in the index combined. Thus, the P/E ratio of any index can be plotted over time. By plotting P/E ratios over time, we can learn something about the way stocks are valued today. Below is a chart plotting the S&P 500 Index’s P/E ratio on trailing 12-month earnings since 1970.
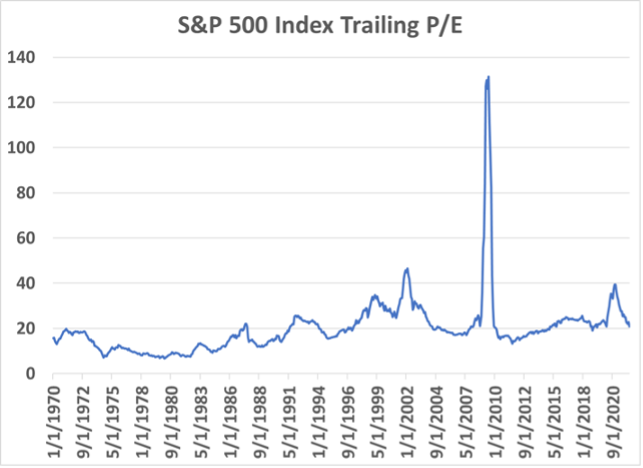
As one can see in the chart above, the S&P 500 Index’s P/E ratio on trailing earnings at the beginning of this year was 40. The market has only been more expensive on this version of P/E twice since 1970: once during the early 2000’s and then in 2009 when earnings (the denominator in the P/E) declined precipitously. This year, with the market declining while earnings have advanced, the P/E ratio is down to a far more reasonable 20-handle. Interestingly, the current P/E on the S&P 500 index is nearly identical to its 52-year average of about 20. On this measure, stocks are no longer expensive, but they’re not cheap either. One standard deviation on this series is 13. This means that 66% of the time, stock P/E’s have traded between 7 and 33. With interest rates moving up and the Fed signaling more rate increases coming to fight inflation, it is not unreasonable to think the P/E could move toward the -1 standard deviation level—that is toward 7. It’s not likely to get there; it’s more likely to drop into the teens.
Earnings Drive Stock Prices
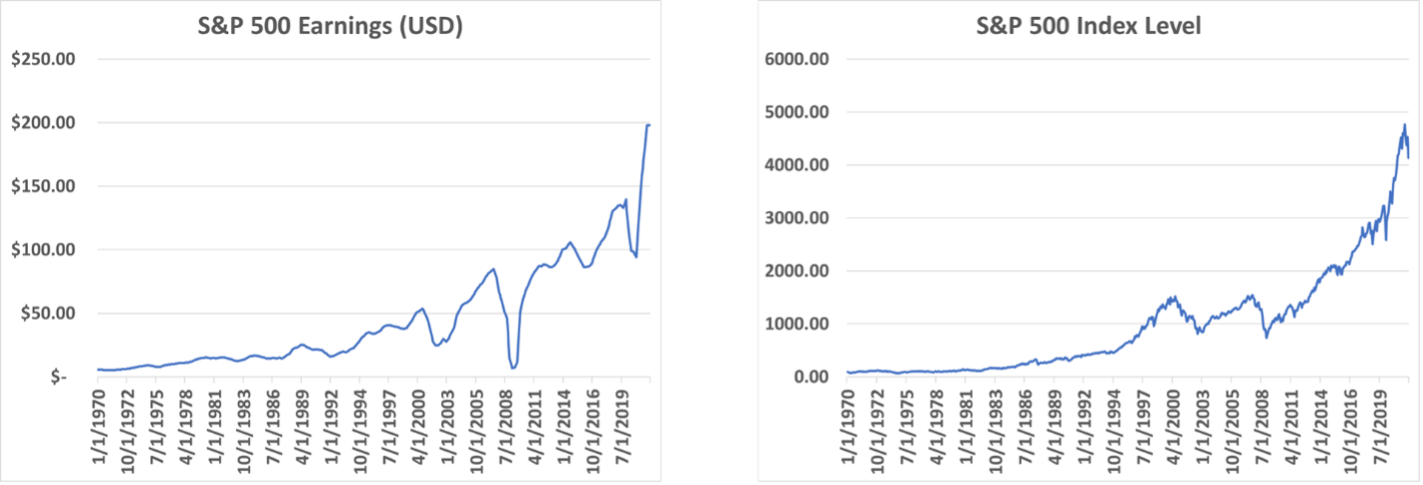
The long-term relationship between stock prices and their underlying earnings is unassailable. Over the long-term, stock prices follow earnings. Here are two charts plus a statistic that will remove any doubt the reader may have. In the first frame are the aggregated earnings levels of the S&P 500 Index companies starting in 1970 through March 2022. In the second frame is the S&P Index level, also starting in 1970. If the picture isn’t convincing enough, a quick excel calculation of the correlation coefficient of these two series is a whopping 0.948! Translated into English, this number means that 94.8% of the variability of the S&P 500 Index level is explained by the variability of S&P 500 earnings. Case closed.
Forward Earnings Expectations Matter
Now let’s shift gears and go from trailing earnings to forecasted earnings. Afterall, the stock market is a forward expectation discounting mechanism; peering into the future to handicap today what will happen later. To create objective measures around such soothsaying, Wall Street analysts create earnings estimates. Almost every publicly traded company of any meaningful size has at least one Wall Street analyst generating forward earnings estimates. Most large capitalization stocks have ten or more analysts generating forecasts. All these estimates can be averaged for each company and then aggregated across all companies to create forward earnings estimates for indexes.
As of March 31, 2022, the trailing 12-month earnings on the S&P 500 Index was $198. This is $198 in the books and on the record. Bank it. Now, as of March 31, the expectation was that the S&P 500 would earn about $210 in 2022. The estimate for 2023 is still $230. Forward estimates really haven’t moved down. Yet.
Let’s do some “What If” analysis
We realize this exercise is simple and prone to error. But it can also be especially useful for framing potential market scenarios; trying to understand the interaction between future earnings, stock prices, and valuation multiples. If S&P 500 earnings grow to $230 in 2023 as current analyst expectation call for, then the current P/E on those forward earnings is about 16. That’s a very reasonable valuation level. On the other hand, if S&P 500 earnings drop to $170 in 2023 then the forward P/E is 22. In case of an earnings recession of -15% like this, then simply maintaining a forward P/E of 16 would suggest an S&P 500 level at 2720. We are not saying S&P 2720 is going to happen; but IT COULD. It seems like a low probability (less than 10%) currently. Nonetheless, this type of scenario is certainly possible.
Here’s the good news: a solid financial plan and appropriate risk management relative to that plan allows for this type of scenario without panic or anxiety. A good plan and proper risk management can do that. It’s never enjoyable, but it is manageable. Conversely, in ugly downside scenarios like the one proffered above, bad planning and risk management are exposed. If you want to better understand these types of scenarios and their impact on your plan, sitting down with your advisor is always helpful. The most important thing is to know you can still reach your goals even when bad things happen.
The BIG FINISH
It is because of this set-up that we wrote the commentary entitled “Maximum Uncertainty” last week. We have 40-year high inflation. We have a Fed on record saying they will risk recession to curtail inflation through aggressive rate increases. We have the probability of recession growing every week. This is the rub: if we have a recession that leads to a corporate earnings recession, then the degree of uncertainty for the stock market outlook grows exponentially. If we lose 15 to 30% of corporate earnings AND P/E multiples contract further, there could still be more pain to come for stock prices. On the other hand, if earnings are still relatively strong and we skirt a bad recession, the worst of it could be over. Therefore, there is a massive amount of attention and focus on the upcoming earnings season which begins after the fourth of July holiday. There hasn’t been an earnings season as important as this one in a very long time. The test starts in July and WILL be graded on a curve. Strap in!