
A Fed Balance Sheet Primer: One Trillion Down… Six to Go?
Below is a picture of the Fed Balance sheet. These are the assets held on the Fed Balance Sheet. This is the economic tool the Fed started using as a policy tool during the Great Financial Crisis. The balance sheet amounts to a mechanism through which the Fed can add or subtract liquidity (i.e., money) to or from the economy. When the balance sheet is growing, money is being added to the economy and, conversely, when the balance sheet is declining, money is being drained from the economy.
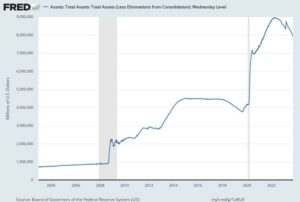
Why is this important? Because the balance sheet is one of the primary mechanisms the Fed uses to manage the money supply (the other is interest rates), which in turn affects inflation. If one scans the line in the chart above and traces its growth over time, a few things stand out.
Firstly, since the GFR, the Fed has increased its balance sheet by a staggering seven trillion dollars.
Secondly, when comparing the balance sheet responses of both the GFR and the COVID-19 crisis, we can see the Fed did more in response to COVID than it did in response to the GFR. BUT it is important to realize as a percentage gain from the starting position, the Fed did WAY MORE in response to the GFR than it did in response to COVID.
This is important because it tells us with each successive move to affect liquidity, the FED must do way more when the starting base is higher! The tool requires more response (i.e., bigger moves) every time it is used. In other words, it becomes less potent over time as it is used.
Thirdly, if one looks to the far right, one can see the rapid hook-up in March of this year in response to the banking failures even while the broader objective was to continue reducing the balance sheet. That March hook back up is what we would like to draw your attention to.
This past week, the September inflation figures were released for both the PPI and the CPI. They look like this:
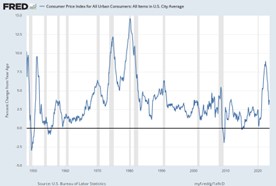
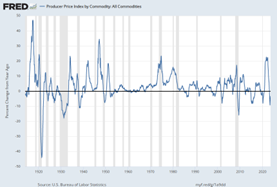
If one compares the March 2023 hook back up in Fed balance sheet assets to the recent stall in inflation progress, it seems plausible if not likely there is a lag relationship between Fed balance sheet asset changes and subsequent inflation. Thus, if true, we should see a resumption of inflation progress soon, as the balance sheet reduction has now progressed apace since April. Time will tell if this supposition is correct, but it is certainly worth careful scrutiny.
Will the Fed successfully reduce its Balance Sheet to pre-COVID level or even pre-GFR levels without something breaking? That’s the seven-trillion-dollar question.
It seems doubtful this will be a smooth process and the Fed may never be able to return its balance sheet to historical levels. The “genie is out of the bottle” and “the horse has left the barn!” Thus, the balance sheet must be monitored to gain clues into the possible inflation and broader economic picture.
With that, we will turn our attention to the quarterly earnings season NEXT week.
As we’ve said in the past, earnings will be highly important to stock market levels in the coming two quarters, as equities still seem to us priced for perfection.
============================================================================================
The S&P 500 Index, or Standard & Poor’s 500 Index, is a market-capitalization-weighted index of 500 leading publicly traded companies in the U.S. The S&P 500 index is regarded as one of the best gauges of prominent American equities’ performance, and by extension, that of the stock market overall.
Indices are unmanaged. An investor cannot invest directly in an index. They are shown for illustrative purposes only and do not represent the performance of any specific investment.
Advisory services offered through WealthPlan Group, a DBA for WealthPlan Investment Management, a subsidiary Registered Investment Advisor of WealthPlan Group, LLC. WealthPlan Group, LLC is not a registered investment advisor, but is the holding company for WealthPlan Partners LLC and WealthPlan Investment Management, LLC.
The opinions voiced in this material are for general information only and are not intended to provide specific advice or recommendations for any individual. To determine which Investment(s) may be appropriate for you, consult your financial advisor prior to investing. Information is based on sources believed to be reliable, however, their accuracy or completeness cannot be guaranteed.
No investment strategy can assure success or completely protect against loss, given the volatility of all securities markets. Statements of forecast and trends are for informational purposes and are not guaranteed to occur in the future. All performance referenced is historical and is no guarantee of future results. Securities investing involves risk, including loss of principal. An investor cannot invest directly in an index.
The information in this communication applies solely to the intended audience and in no way amends, revokes, or otherwise alters the existing agreements and relationships between WPIM and its clients. This communication is not a binding offer, expressed or implied. WPIM undertakes no obligation to update or revise the information herein or in any referenced third-party resource due to new information, future events or circumstances, or otherwise.
WealthPlan Investment Management (“WPIM”) uses data compiled and/or prepared by third parties (“Third Party Data”) in the delivery of Licensed Research and Data. Third Party Data is not owned by WPIM and user may be required to obtain permission directly from third parties for further use of Third-Party Data and may be required to pay a fee depending on the use contemplated by the user.