
Thanksgiving Week

As we enter a trading week interrupted by Thanksgiving, it is a good time to take a pause and survey the broader economic picture. Here are the important drivers:
- Inflationary pressures continue to recede; but there is some stubbornness to it.
- The Fed continues to be vigilant with its tightening policies and rhetoric.
- The Federal government’s finances continue to be shaky at best due to deficit spending and total debt burden in this higher rate environment.
- US GDP continues in its strength.
- US corporate earnings are reaccelerating.
- The stock market is strengthening and broadening; but the top ten market cap stocks continue to dominate.
- Stock markets are still below the all-time highs established at the beginning of 2022.
- Stocks are somewhat expensive, but not so much relative to forward earnings expectations.
- The jury is still out as to whether we get a soft or hard economic landing given interest rate levels.
For perspective, here’s a longer-term chart of various stock indices:
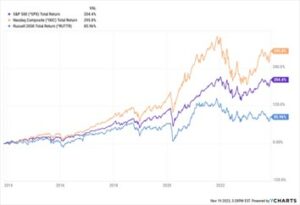
So, whether the stock market can return to and exceed the two-year old all-time highs is in focus right now. It comes down to corporate earnings and whether we can avoid a recession. At this stage, it seems it could go either way and we will learn a great deal in the first quarter of next year. In the meantime, as we prepare to enter the 2023 holiday season, we still have a good chance of seeing another Santa Claus rally in stock markets. Enjoy your turkey dinner, football, and time with your loved ones. Happy Thanksgiving!
=====================================================================================
The S&P 500 Index, or Standard & Poor’s 500 Index, is a market-capitalization-weighted index of 500 leading publicly traded companies in the U.S. The S&P 500 index is regarded as one of the best gauges of prominent American equities’ performance, and by extension, that of the stock market overall.
The NASDAQ Composite is a stock market index of common stocks and similar securities listed on the NASDAQ stock market. The composition of the NASDAQ Composite is heavily weighted towards information technology companies.
The NASDAQ-100, whose components are a subset of the NASDAQ Composite’s, accounts for over 90% of the NASDAQ Composite’s movement, and there are many ETFs tracking its performance.
The Russell 2000 tracks the roughly 2000 securities that are considered to be US small cap companies. The Russell 2000 serves as an important benchmark when investors want to track their small cap performances versus other sized companies. The Russell 2000 tends to have a larger standard deviation in comparison to the S&P 500.
The Dow Jones Industrial Average, or simply the Dow, is a stock market index that indicates the value of 30 large, publicly owned companies based in the United States, and how they have traded in the stock market during various periods of time. These 30 companies are also included in the S&P 500 Index. The value of the Dow is not a weighted arithmetic mean and does not represent its component companies’ market capitalization, but rather the sum of the price of one share of stock for each component company. The sum is corrected by a factor which changes whenever one of the component stocks has a stock split or stock dividend, so as to generate a consistent value for the index.
The Bloomberg US Aggregate Bond Index (^BBUSATR) is used as a benchmark for investment grade bonds within the United States. This index is important as a benchmark for someone wanting to track their fixed income asset allocation.
Indices are unmanaged. An investor cannot invest directly in an index. They are shown for illustrative purposes only and do not represent the performance of any specific investment.
Advisory services offered through WealthPlan Group, a DBA for WealthPlan Investment Management, a subsidiary Registered Investment Advisor of WealthPlan Group, LLC. WealthPlan Group, LLC is not a registered investment advisor, but is the holding company for WealthPlan Partners LLC and WealthPlan Investment Management, LLC.
The opinions voiced in this material are for general information only and are not intended to provide specific advice or recommendations for any individual. To determine which Investment(s) may be appropriate for you, consult your financial advisor prior to investing. Information is based on sources believed to be reliable, however, their accuracy or completeness cannot be guaranteed.
No investment strategy can assure success or completely protect against loss, given the volatility of all securities markets. Statements of forecast and trends are for informational purposes and are not guaranteed to occur in the future. All performance referenced is historical and is no guarantee of future results. Securities investing involves risk, including loss of principal. An investor cannot invest directly in an index.
The information in this communication applies solely to the intended audience and in no way amends, revokes, or otherwise alters the existing agreements and relationships between WPIM and its clients. This communication is not a binding offer, expressed or implied. WPIM undertakes no obligation to update or revise the information herein or in any referenced third-party resource due to new information, future events, or circumstances, or otherwise.
WealthPlan Investment Management (“WPIM”) uses data compiled and/or prepared by third parties (“Third Party Data”) in the delivery of Licensed Research and Data. Third Party Data is not owned by WPIM, and user may be required to obtain permission directly from third parties for further use of Third-Party Data and may be required to pay a fee depending on the use contemplated by the user.